
Introduction
In the dynamic world of financial markets, traders rely on a plethora of tools and techniques to make informed decisions. Among these, candlestick charts stand out as one of the most visually compelling and insightful methods for analyzing price movements. Originally developed by Japanese rice traders in the 18th century, candlestick charts have transcended time and culture, becoming an indispensable tool in modern trading. In this article, we will delve deep into the art of reading candlestick charts, demystifying their components and providing invaluable insights into how to interpret them effectively.
Components of a Candlestick Chart
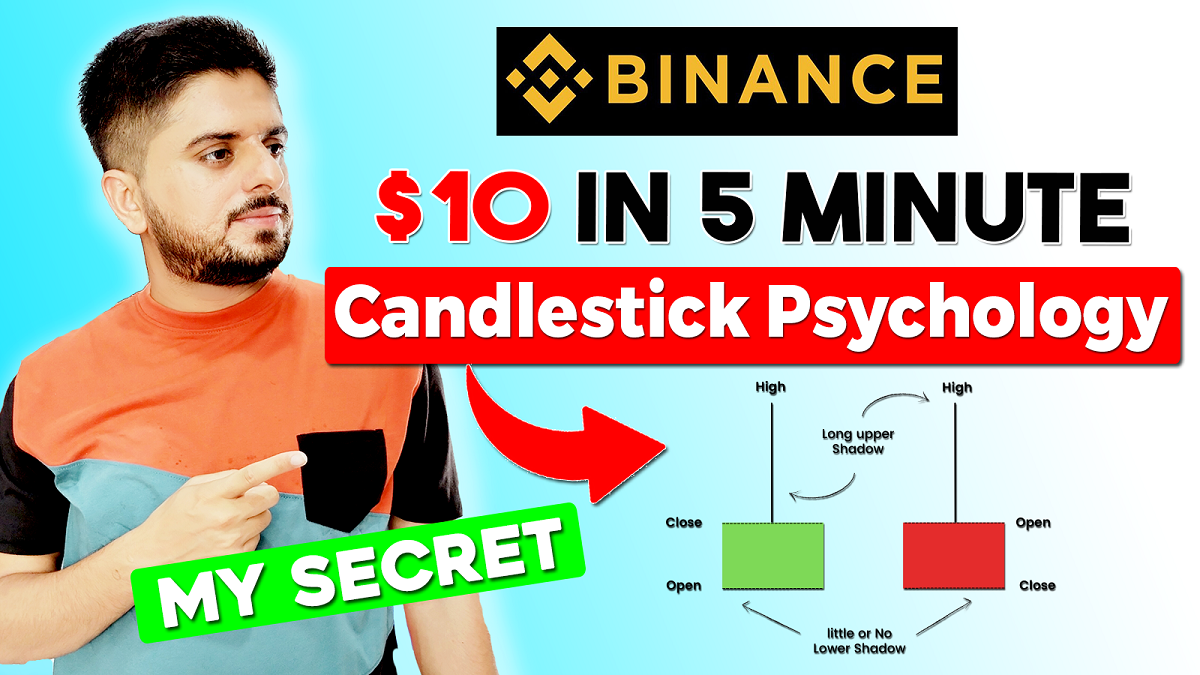
A candlestick chart is made up of four components:
- The open price: This is the price at which the asset first traded during the time period represented by the candle.
- The high price: This is the highest price that the asset traded during the time period represented by the candle.
- The low price: This is the lowest price that the asset traded during the time period represented by the candle.
- The close price: This is the price at which the asset last traded during the time period represented by the candle.
The open price and close price are used to create the body of the candle. The high price and low price are used to create the wicks, or shadows, of the candle.
Color of Candlestick Charts
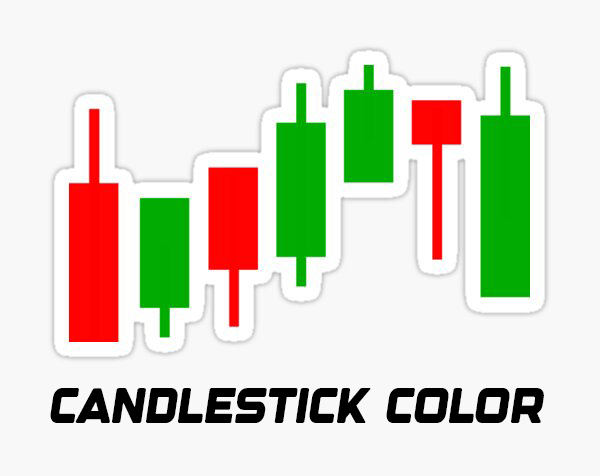
The color of a candlestick chart can be used to indicate the direction of the price movement. Green candles indicate that the price closed higher than it opened, while red candles indicate that the price closed lower than it opened.
Candlestick Patterns
Candlestick patterns are groups of candles that form specific formations. These formations can be used to identify trends, reversals, and other trading opportunities.
The Anatomy of a Candlestick
A candlestick on a chart represents the price movement of a financial asset over a specific time period, whether it’s a minute, an hour, a day, or even longer. Each candlestick consists of four main components:
- Body: The rectangular body of the candlestick represents the price range between the opening and closing prices during the selected time period. If the closing price is higher than the opening price, the body is usually filled or colored, commonly green or white. Conversely, if the closing price is lower than the opening price, the body is left unfilled or colored, often red or black.
- Wicks (Shadows): These are the thin lines that extend above and below the body. The upper wick represents the highest price reached during the time period, while the lower wick represents the lowest price. The wicks provide insight into the price range and the volatility experienced during the trading session.
- Upper Wick: This part of the candlestick extends from the top of the body to the highest price reached during the time period.
- Lower Wick: This part of the candlestick extends from the bottom of the body to the lowest price reached during the time period.
Interpreting Candlestick Patterns
Candlestick charts become truly powerful when certain patterns emerge across multiples candles. These patterns provide traders with valuable signals that can help predict potential price movements. Here are a few common candlestick patterns and their interpretations:
- Doji
- Bullish Engulfing
- Bearish Engulfing
- Hammer
- Shooting Star
- Morning Star
- Evening Star
- Harami
- Doji: A Doji candlestick has a small body, indicating that the opening and closing prices are very close or nearly the same. This pattern suggests indecision in the market, often signaling a potential reversal.
- Bullish Engulfing: This pattern occurs when a small bearish candle is followed by a larger bullish candle that completely engulfs the previous candle’s body. It’s seen as a bullish reversal signal.
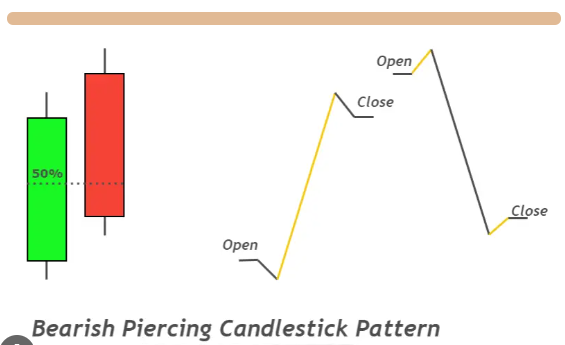
- Bearish Engulfing: Conversely, a bearish engulfing pattern involves a small bullish candle followed by a larger bearish candle that engulfs the previous candle. This suggests a potential bearish reversal.
- Hammer: A hammer candlestick has a small body with a long lower wick, resembling a hammer. It indicates a potential reversal from a downtrend to an uptrend.
- Shooting Star: This is the opposite of a hammer. It has a small body with a long upper wick, indicating a potential reversal from an uptrend to a downtrend.
- Morning Star: A morning star pattern consists of three candles – a large bearish candle, followed by a small-bodied candle (Doji or spinning top), and then a large bullish candle. This signals a potential bullish reversal.
- Evening Star: This is the opposite of the morning star. It begins with a large bullish candle, followed by a small-bodied candle, and then a large bearish candle. It suggests a potential bearish reversal.
- Harami: A harami pattern involves a small candle (the “baby” candle) inside the body of the previous larger candle. It can indicate a potential trend reversal.
Using Candlestick Patterns in Trading
While recognizing candlestick patterns is essential, it’s equally important to consider other factors before making trading decisions. Here’s how to integrate candlestick patterns into your trading strategy:
- Confirmation: Always wait for confirmation before acting on a candlestick pattern. This could involve waiting for the next candle to confirm the pattern before making a trade.
- Timeframes: Different timeframes can yield different patterns and signals. Shorter timeframes may be more volatile, while longer timeframes provide more significant trend insights.
- Support and Resistance: Consider the context of candlestick patterns in relation to support and resistance levels. A pattern that forms near a strong support or resistance level carries more weight.
- Volume: Volume can validate the strength of a candlestick pattern. High volume during a pattern’s formation adds credibility to the potential price movement.
- Market Conditions: Remember to consider broader market conditions and economic indicators. A bullish candlestick pattern in a bearish market might not be as effective.
Conclusion
Candlestick charts are a remarkable tool that enables traders to gauge market sentiment and forecast potential price movements. By understanding the anatomy of a candlestick and mastering the interpretation of various candlestick patterns, traders can gain a competitive edge in their decision-making process. However, it’s important to remember that while candlestick patterns offer valuable insights, they are not foolproof and should be used in conjunction with other technical and fundamental analysis tools. As with any trading strategy, practice, experience, and continuous learning are the keys to successfully integrating candlestick chart reading into a comprehensive trading approach.